posted in Selfhosted

What sort of things do y'all monitor with Grafana / Beszel / etc.?

Have been working on my Grafana dashboard recently and am thinking about what else I could add. So far, I have:

  • CPU usage and temperature
  • Memory usage
  • Network usage
  • Backrest daily backup status
  • SMART status of drives
  • CPU and memory usage of containers

Anything else that you find useful? I have a few other ideas, but am curious what others have up. Is everything on one scrollable dashboard, or do you have it organized across multiple?
Replying to @⁨glorp@lemmy.world⁩

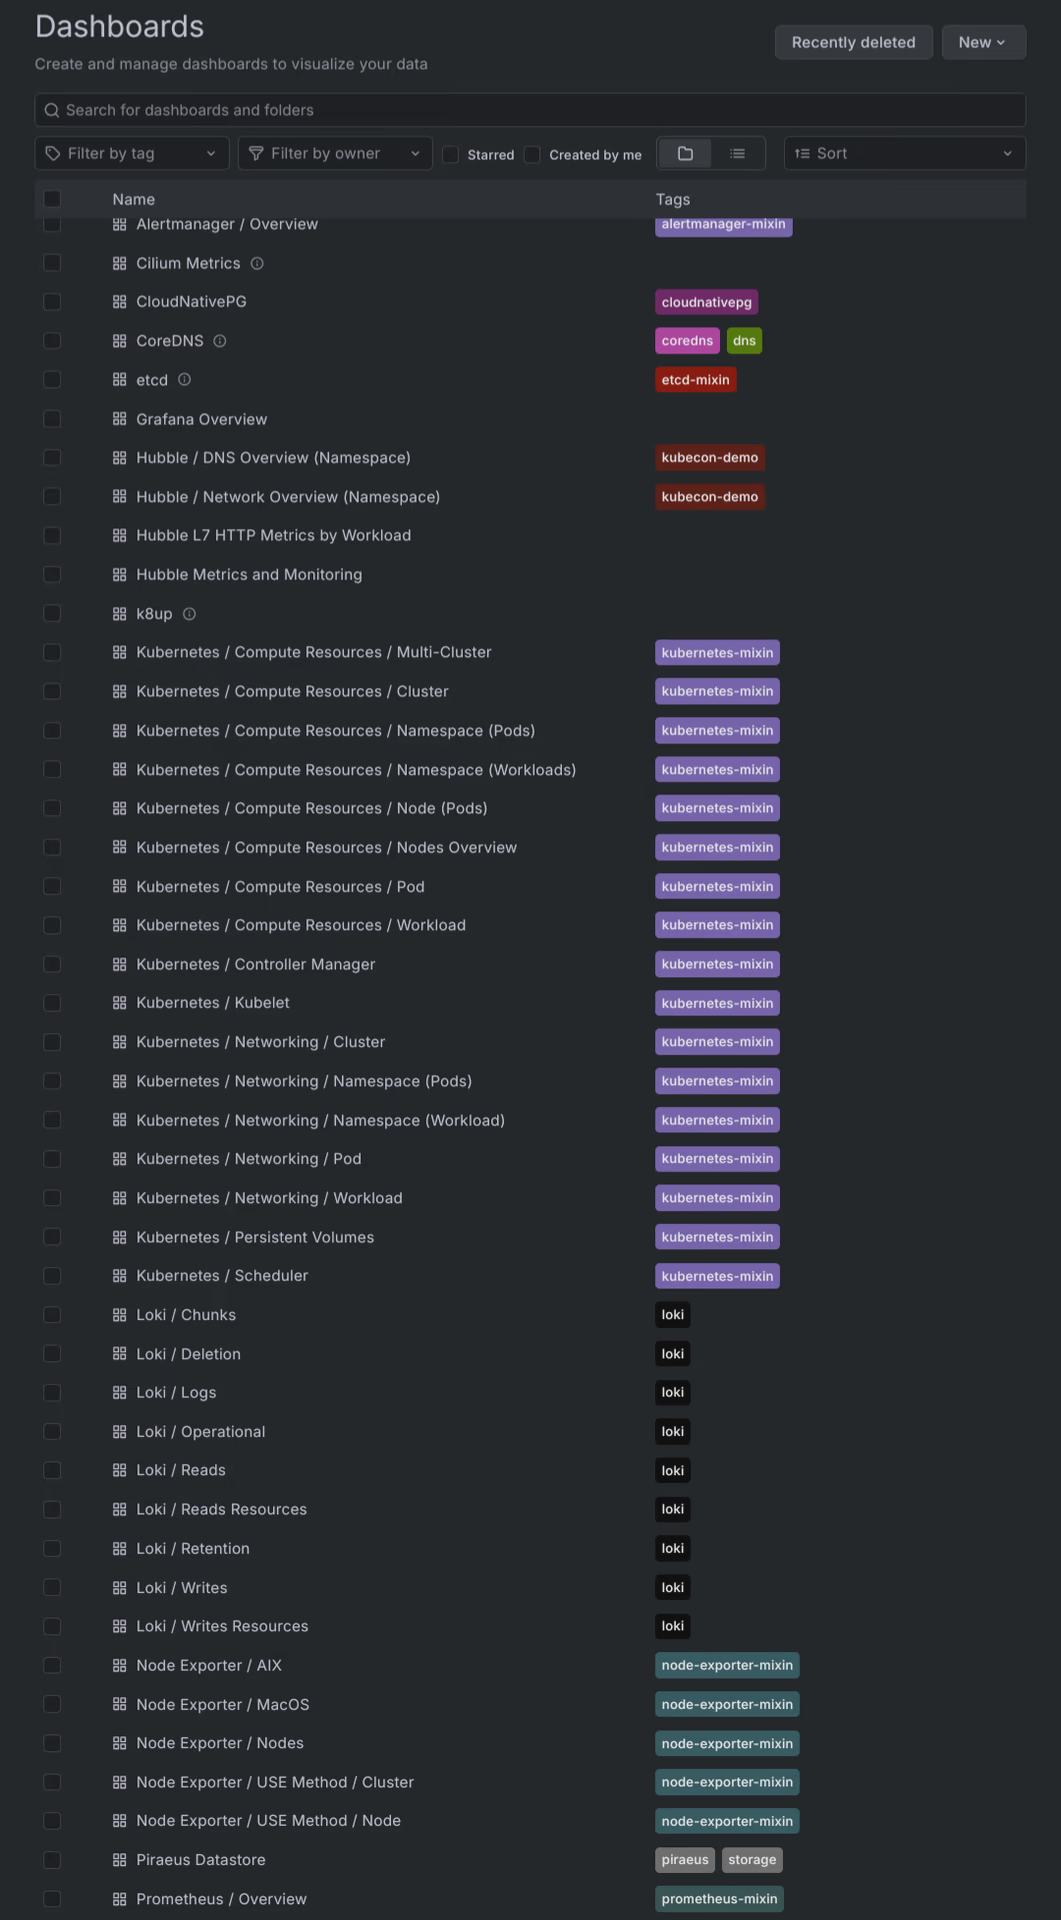
I mean, I got the whole set of default dashboards, some for networking and one each for backups (k8up) and Postgres (CloudNativePG), but I don’t look at them often, usually only if something’s wrong. I also have logs available via Grafana, but I don’t have any dashboards for that, I just query what I need. If I ever have enough time and motivation, some things I’d put on a kind of overview dashboard would be in addition to your list:

  • zpool health (scrub status, IO etc.)
  • list of crashing pods
  • list of warnings from FluxCD (e.g. application upgrade failures or invalid manifests)
  • list of failing persistent volumes

Replying to @⁨silenium_dev@feddit.org⁩

I think aggregating logs would be a good choice, yeah. My homelab is distributed across 5 machines, so it’s been getting a little unruly to ssh into them all the time. I actually haven’t taken a look at premade dashboards - completely forgot those exist. I’ve just been writing the PromQL by hand to learn how it all works before adding premade things

Edited ⁨⁨Oct⁩ ⁨13⁩, ⁨2026⁩, ⁨00:48⁩⁩en