← Back to post

Edit history

Most recent

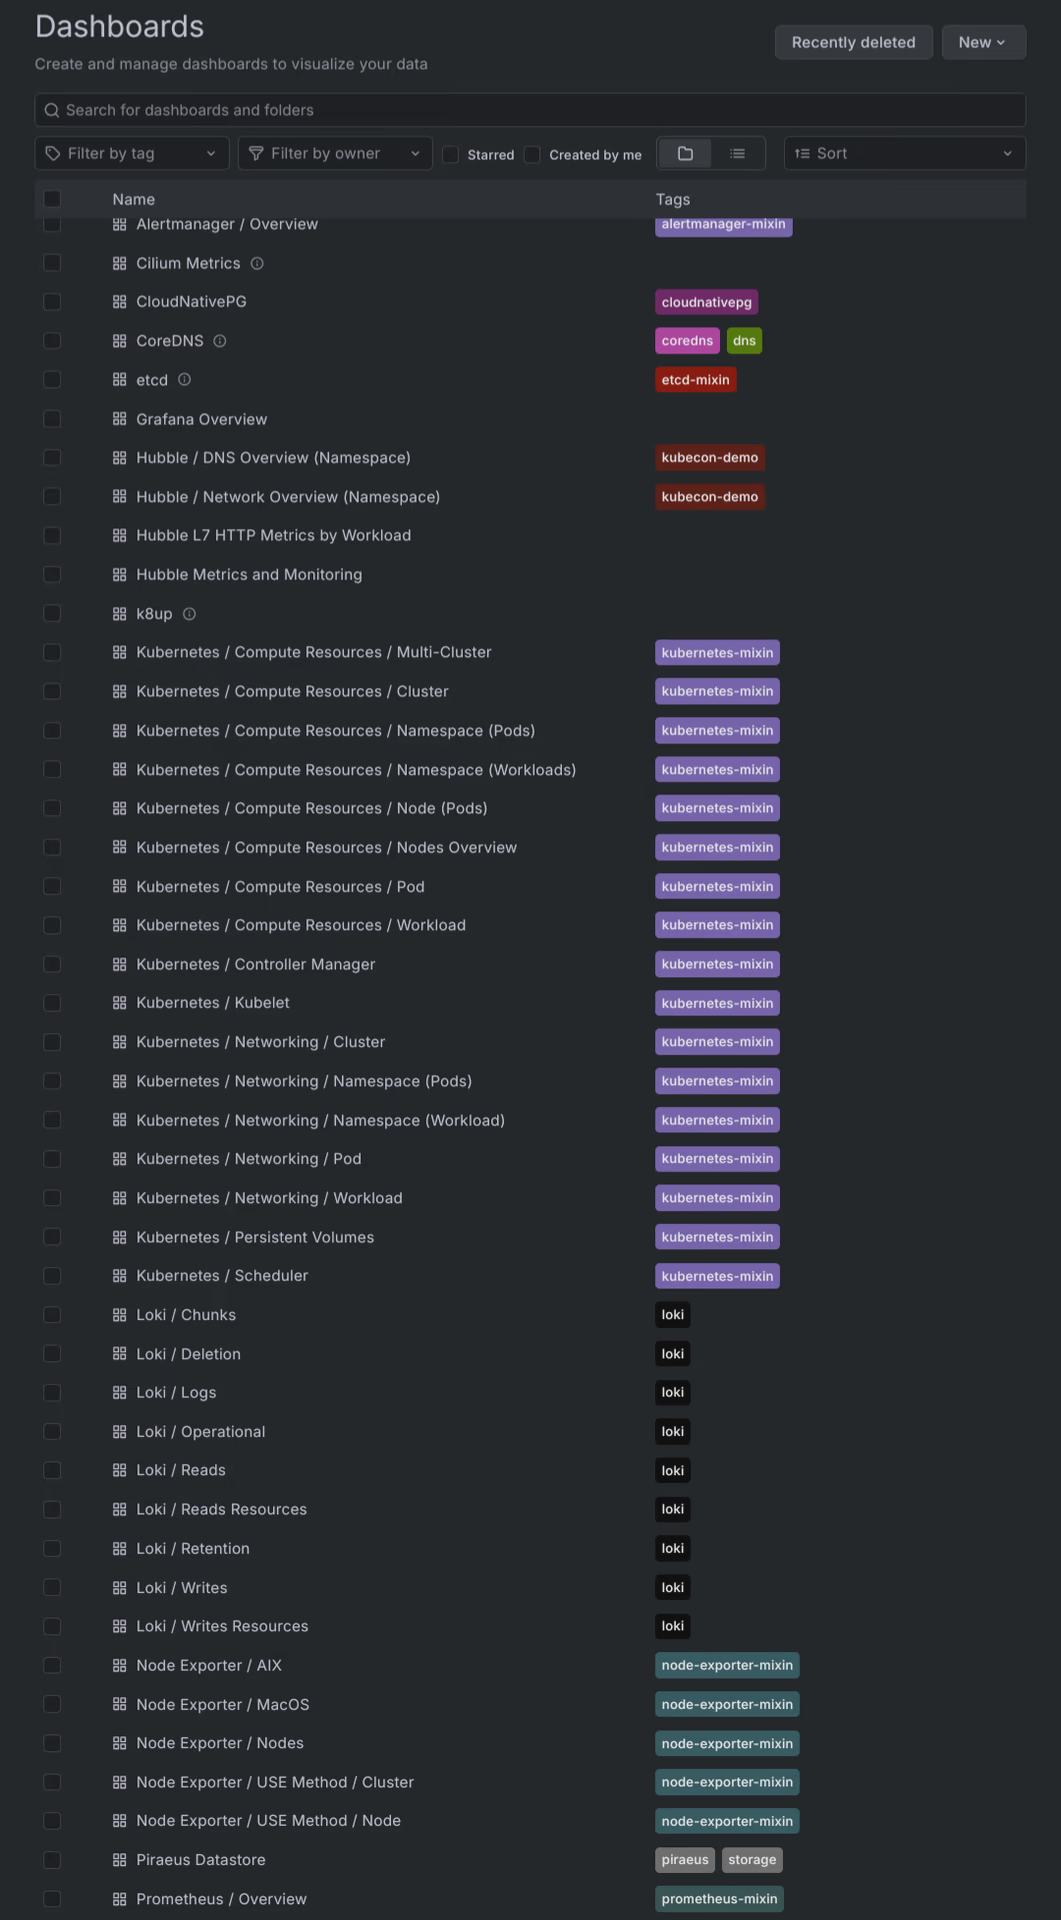
I mean, I got the whole set of default dashboards, some for networking and one each for backups (k8up) and Postgres (CloudNativePG), but I don’t look at them often, usually only if something’s wrong. I also have logs available via Grafana, but I don’t have any dashboards for that, I just query what I need. If I ever have enough time and motivation, some things I’d put on a kind of overview dashboard would be in addition to your list:

  • zpool health (scrub status, IO etc.)
  • list of crashing pods
  • list of warnings from FluxCD (e.g. application upgrade failures or invalid manifests)
  • list of failing persistent volumes
Edited

I mean, I got the whole set of default dashboards, some for networking and one each for backups (k8up) and Postgres (CloudNativePG), but I don’t look at them often, usually only if something’s wrong. I also have logs available via Grafana, but I don’t have any dashboards for that, I just query what I need.

Original

I mean, I got the whole set of default dashboards, some for the networking and one each for backups (k8up) and Postgres (CloudNativePG), but I don’t look at them often, usually only if something’s wrong. I also have logs available via Grafana, but I don’t have any dashboards for that, I just query what I need.