posted in Selfhosted

What sort of things do y'all monitor with Grafana / Beszel / etc.?

Have been working on my Grafana dashboard recently and am thinking about what else I could add. So far, I have:

  • CPU usage and temperature
  • Memory usage
  • Network usage
  • Backrest daily backup status
  • SMART status of drives
  • CPU and memory usage of containers

Anything else that you find useful? I have a few other ideas, but am curious what others have up. Is everything on one scrollable dashboard, or do you have it organized across multiple?
Edited ⁨⁨Oct⁩ ⁨12⁩, ⁨2026⁩, ⁨19:51⁩⁩enPage

Replying to @⁨glorp@lemmy.world⁩

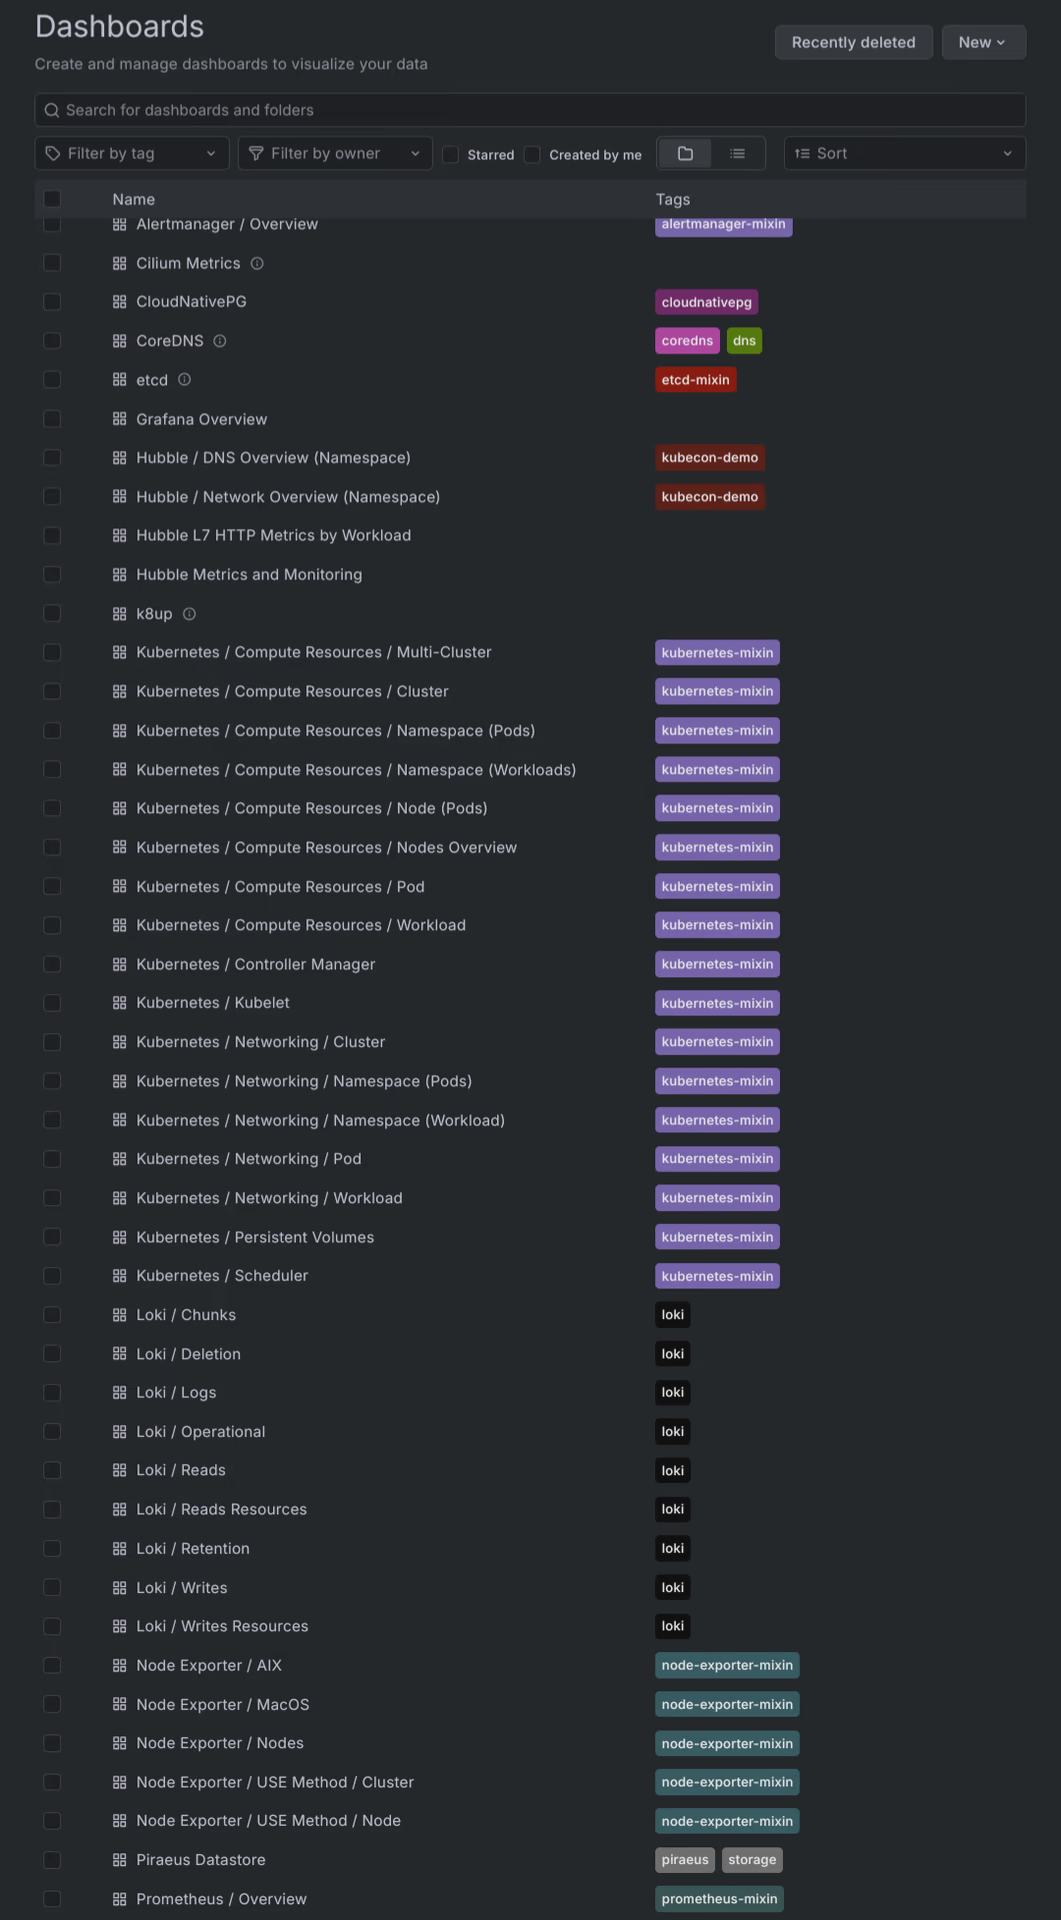
I mean, I got the whole set of default dashboards, some for networking and one each for backups (k8up) and Postgres (CloudNativePG), but I don’t look at them often, usually only if something’s wrong. I also have logs available via Grafana, but I don’t have any dashboards for that, I just query what I need. If I ever have enough time and motivation, some things I’d put on a kind of overview dashboard would be in addition to your list:

  • zpool health (scrub status, IO etc.)
  • list of crashing pods
  • list of warnings from FluxCD (e.g. application upgrade failures or invalid manifests)
  • list of failing persistent volumes

Replying to an earlier post

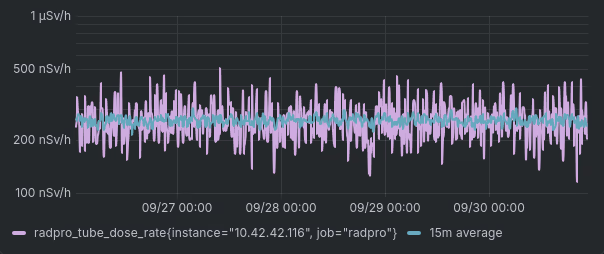
Right now I’m just using it for an AirGradient dashboard, which is an open hardware / open software air quality monitor. I used claude to rewrite the firmware to send the data to prometheus instead if their own servers, and countless other frustrating changes because they make the whole operation dependent on a connection to their servers…anyway, I didn’t want to pay a subscription for something so simple. I’ve thought about using it for some other projects, but for a lot of stuff I just don’t see the need for a dedicated dash.

Replying to @⁨zorflieg@lemmy.world⁩

Beszel is really cool! I was actually planning to set that up at first, but I really wanted to learn Grafana / Prometheus and have the flexibility to customize things how I wanted. That’s definitely my biggest annoyance with using Grafana - I have five machines setup, and each one has 3 containers for monitoring (cAdvisor, smartctl_exporter, node_exporter), so it got pretty tiring to put up so many containers.

Replying to @⁨glorp@lemmy.world⁩

I’d add backup age and size, not just status, like alert if the newest dump is older than ~26h or smaller than 1MB, a job can say success and still leave you a useless file. and disk fill with a threshold, not only the graph. learned that one the hard way, a table on my vps was getting a row every minute with no cleanup and one day the disk hit 100% and postgres just died for like 40 min, obviously nobody was looking at the dashboard right then lol. now 80% warns and 90% sends me an email, and uptime kuma checks the cert expiry from outside. I guess the dashboard is nice to look at but the stuff that matters should ping you

Replying to @⁨ultimaluz@lemmy.world⁩

Size is a great idea, thanks. The problem with backup age is that Backrest doesn’t expose a metric for when the backup was attempted, so right now it’s just checking for failure status daily. That, of course, fails if backrest doesn’t attempt a backup for whatever reason. Chances of that happening, I don’t know, but I’ll have to look into implementing the metric (or label, I suppose) myself.